
Curious how the British Design Museum used data to improve the museum experience? Listen to DEN's podcast Cultuurshift Season 3, Episode 3: Managing crowds and visitor flows with data.
Behavior changes
Josephine Chanter, deputy director of the Design Museum in London, clearly outlines the challenge for the cultural sector: “The battle for attention has completely erupted. Cultural organizations must work incredibly hard to reach people to share the stories that matter to them.” She fully embraces the use of data to gain more insight into this. “We want to respond to visitor behaviors so we can adapt.”
Movement patterns
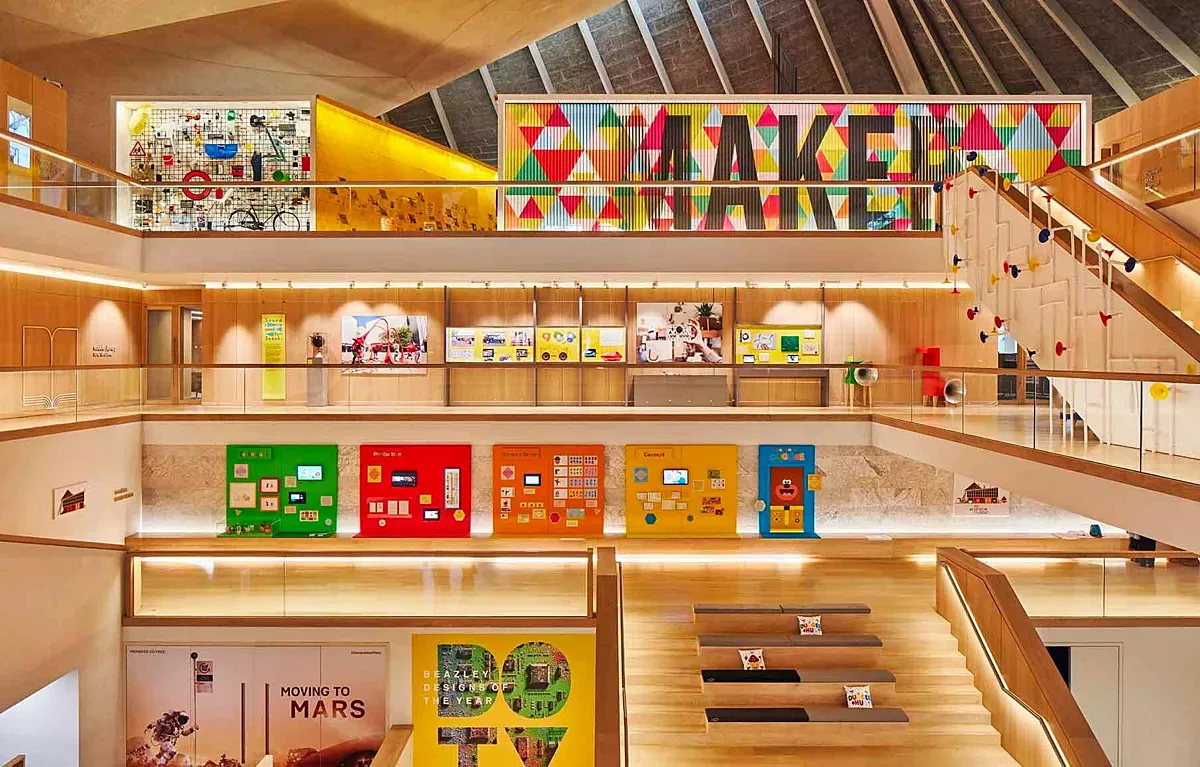
To gain insight into how people move through the museum, visitors are asked to scan their tickets for each exhibition or hall. Not to monitor the visitor, but to recognize patterns. Where does it get too crowded? Which gems are being skipped? This provides insight into whether people come solely for the popular Wes Anderson exhibition or visit multiple halls. But this revealed a significant obstacle: digital systems that don’t communicate with each other.
Systems that don’t ‘communicate’
Josephine Chanter shares an honest insight: at the Design Museum, different datasets and ticketing systems initially couldn’t ‘communicate’ with each other. A single ticket had a different identifier than a subscription. It wasn’t possible to integrate these different types into the CRM. The result: to extract valuable insights from the data, a completely new ticketing system had to be purchased, a significant investment.
But this was necessary, Chanter says: “If you don’t know what your visitors are doing in the building, you can’t retain them, so this is primary business information.”
Digital strategy + 6 KPIs
Data only becomes meaningful when it’s part of the broader vision and mission of the organization. During a strategy review, pillars emerged under which six KPIs were established. “These are six data points that are most important to us and that we want everyone in the organization to focus on,” Chanter explains.
Key Performance Indicator:
The first is about employees: we want to score 80% on staff satisfaction.
Key Performance Indicator:
Increase visitor numbers from 650,000 to 800,000.
Key Performance Indicator:
Encourage visitors to spend more during their visit, for example in the shop: from seven to nine British pounds.
Key Performance Indicator:
We want to resolve the deficit on the balance sheet.
Key Performance Indicator:
Visitors often rate their visit highly, but we want more people to recommend the museum to others; the NPS needs to go up.
Key Performance Indicator:
And finally, we want to achieve a 21% reduction in CO2 emissions.
Her main advice: "Ensure the digital strategy doesn’t sit with just one department but runs throughout the organization so that everyone feels ownership."
Data as evidence
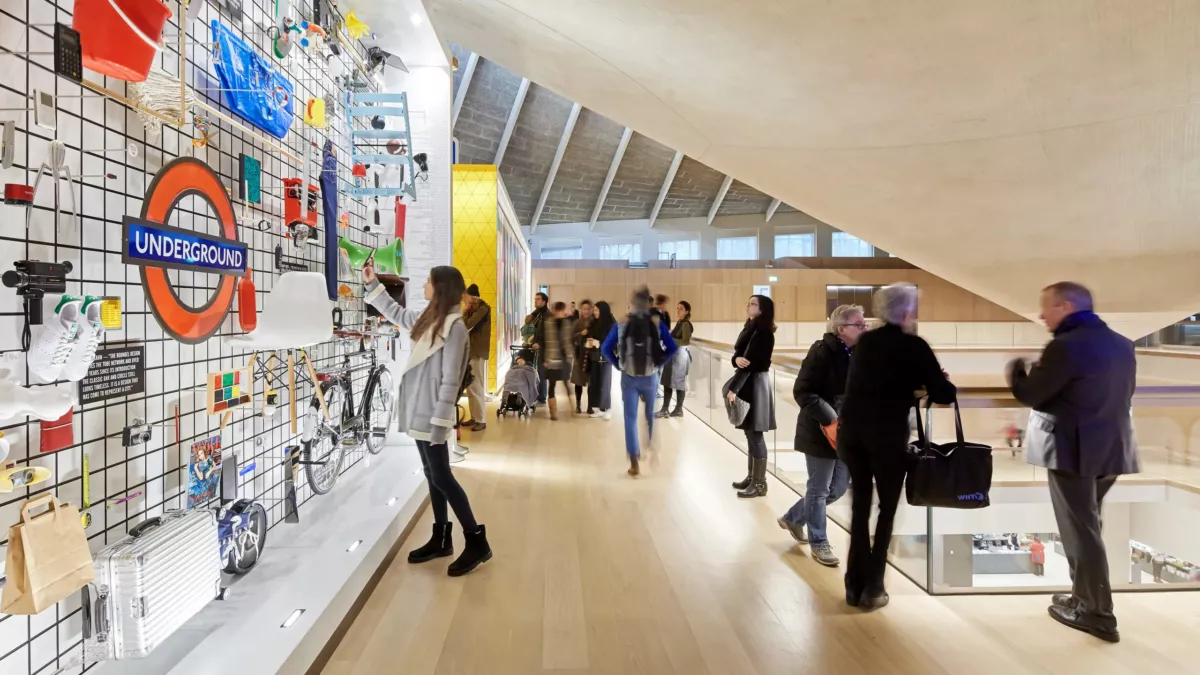
Not everyone gets excited about the word 'data' right away. The solution to getting people on board in your organization is simple, according to Chanter: “shift the focus. Don’t present data as a cold table, but as an insight that directly helps a colleague. If a curator can see that a certain object is consistently overlooked due to a poor route layout, data suddenly becomes an ally in the creative process.”
Data then takes on the role of evidence rather than a starting point.
Curious about the episode of ‘Cultuurshift’ where Anic van Damme, Splinter Chabot, and Innovation expert from the Rijksmuseum Evita Goettsch discuss this approach? In this video, you can watch the entire podcast episode.

Podcast Cultuurshift Season 3
In the third season of the podcast ‘Cultuurshift,’ we speak with a different foreign pioneer in culture and technology in each episode. Think of innovations around gamification, AI, and data-driven work. How do they approach it, and what is the significant added value for their audience and organization?
Host Anic van Damme and sidekick Splinter Chabot discuss this case with an expert from the sector and ask the question: what inspiration can we in the Netherlands draw from this innovative example?
More articles per topic